Elevated vibration on a process pipeline usually means one of two things: mechanical resonance, or a fatigue clock that’s already running. A pipeline vibration analysis using Finite Element Analysis (FEA) tells you which one you’re dealing with and how much time you have before it becomes a failure.
That was the brief on a Mechartes’ recent project for a critical pipeline connecting two process units. Routine monitoring had flagged elevated vibration on the line, and the client needed to know whether the structure was at risk. Here’s how we approached the pipeline vibration analysis, and what it found.
Vibration on a pipeline isn’t automatically a red flag. It becomes one when the driving frequency of whatever is exciting the line, whether that’s flow-induced turbulence or equipment operation, gets close to one of the pipeline’s own natural frequencies. When that happens, the dynamic response amplifies, and both displacement and stress climb.
A pipeline vibration analysis starts with a hypothesis. On this project, the measured vibration behavior and the operating conditions pointed toward mechanical resonance as the likely cause, and that hypothesis had to be tested against a model before we could act on it.
Getting from “we suspect resonance” to “here’s the fatigue life” takes a few distinct steps, and each one feeds the next. Rushing the model building is where a lot of vibration assessments go wrong.
We started by reviewing the vibration measurements the client had already collected, working through the characteristics and severity of what was showing up on the line. That data confirmed the resonance hypothesis and became the calibration reference for the numerical model, tying the measured response back to actual structural behavior.
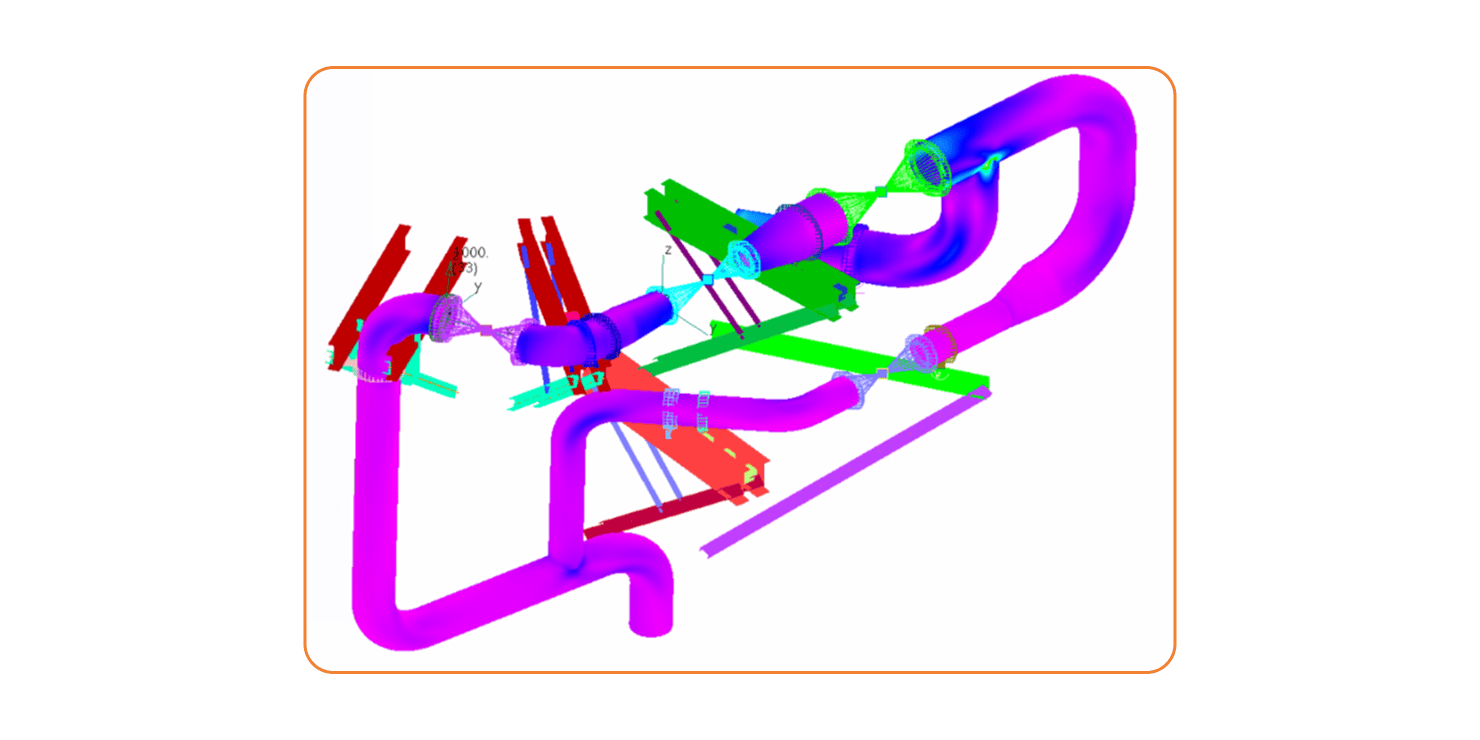
We built a detailed FEA model of the full pipeline system: routing and geometry, supports and support configurations, equipment and connection points, pipe contents and insulation weight, and the relevant boundary conditions and material properties.
The support flexibility piece mattered more than it might sound. Support stiffness has a real influence on natural frequencies and dynamic response, so instead of applying idealized restraints at support points, we modeled the supporting steel explicitly. It’s slower, but it’s the difference between a model that predicts real behavior and one that just looks plausible.
With the model built, we ran a modal analysis to pull out the natural frequencies and mode shapes, then checked those against the known operating and excitation frequencies. We applied a harmonic force at the relevant driving frequencies and calibrated it until the predicted displacement matched the measured vibration. From there, we extracted dynamic stress amplitudes at the locations under the highest stress.
Those stress amplitudes fed a fatigue assessment using Miner’s Rule, weighing the stress ranges and cycle counts against allowable fatigue damage criteria. This is the step that turns “there’s resonance” into an actual number: how much fatigue life is left, and how close this pipeline is to a real failure risk.
The pipeline vibration analysis established the dynamic characteristics of the line and correlated the measured vibration with the predicted structural response. Cumulative fatigue damage under the assessed operating conditions came out below 0.20. The pipeline doesn’t present an immediate fatigue failure concern, and there’s a substantial margin left. That margin is specific to the duty assessed, though. A change in operating cycles or excitation source would need a fresh look.
Even with the fatigue result coming back clean, we recommended structural modifications to bring down the pipeline’s vibration susceptibility going forward. The target was raising the first natural frequency to at least 4 Hz, in line with DNV-RP-D101, Clause 2.2.7.1, which sets a lowest natural frequency of 4 to 5 Hz for piping systems supported per good practice.
That range balances adequate separation from common low-frequency excitation, practical support spacing, controlled project cost, and enough thermal flexibility left in the system. Getting the added supports right also improves overall dynamic stability and gives extra margin against future vibration-induced fatigue.
Mechanical resonance happens when the excitation frequency acting on a pipeline approaches one of its natural frequencies. The dynamic response amplifies, driving up displacement and stress at critical locations.
Dynamic stress amplitudes from the FEA model, calibrated against measured vibration, are run through a fatigue assessment using Miner’s Rule. This weighs stress ranges against cycle counts to produce a cumulative damage figure, checked against allowable criteria.
DNV-RP-D101, Clause 2.2.7.1 recommends a lowest natural frequency of 4 to 5 Hz for a piping system supported according to good pipe support practice, balancing excitation separation, support spacing, cost, and thermal flexibility.
The pipeline vibration analysis established the dynamic characteristics of the line, correlated the measured vibration with the predicted structural response, and quantified the resulting fatigue risk. With cumulative fatigue damage below 0.20 under the assessed operating conditions, the pipeline did not present an immediate fatigue failure concern, although the remaining margin remains dependent on the current operating duty.
Vibration, resonance, and fatigue assessment of piping systems is core work for us at Mechartes, across oil and gas and water infrastructure projects. If you’re seeing similar behavior on your systems, get in touch to talk through what a pipeline vibration analysis would look like for your line.